
MACLOUD
Marine Cloud Brightening
MACLOUD
Marine Cloud Brightening
To address our vision, we propose the following exciting and ambitious programme structured into 5 work-packages (WPs):-
WP1: Fundamental understanding through explicit process modelling (Lead – Connolly, UoM 36 PDRA months, UoE co-I Partridge, UoO co-I Stier): This WP will assess and improve the treatment of particularly problematic cloud and aerosol processes relevant for MCB within the multi-scale range of models of MACLOUD. The three keys areas are:-
WP1.1) Evaporation of MCB spray; 6 PDRA months (UoO), 6 PDRA months (UoL): The ambient concentration of sea-salt in sea-water is around 3.5%, therefore the representation of prognostic aerosol water by sprayers is required to simulate the effect of near-source evaporative cooling in the seawater aerosol plume. We will develop a simple representation of prognostic aerosol water in ICON-HAM-lite and the UM that will explicitly represent this effect.
WP1.2) The radiative effect of unactivated aerosol within clouds; 18 PDRA months (UoM). We will improve the Cloud–AeroSol Interacting Microphysics (CASIM) microphysics scheme to calculate the uptake of water to unactivated interstitial aerosol particles under high relative humidities within clouds and derive hydrated aerosol optical parameters for radiative transfer calculations1. These will be tested against detailed, offline, bin-microphysics model calculations. We will evaluate the impact of interstitial aerosol in the UM for marine clouds for a range of initial background aerosol2 and a range of spray aerosol distributions. The new parameterisation will be used in WP2 and WP3.
WP1.3) Improving and validating cloud droplet activation for MCB using emulation; 18 PDRA months (UoM). The Pseudo-Adiabatic bin-micRophySis university of Exeter Cloud parcel model (PARSEC, https://github.com/UoE-ACC) eliminates the known deficiencies of the ARG scheme (see Vision) for MCB studies. It is in the UM but is too computationally expensive for centennial runs. A fast Gaussian Process (GPs) emulator (PARSEC-GP) has been developed, but is unable to represent the condensation sink of pre-existing droplets or interstitial spray particles on activation of new aerosols. We will use deep Gaussian Process Emulation3, and Flux-defined Neural Differential Equations4 to rectify these issues. Both approaches are fast and enable computation of the PDF of CDNC associated with sub-grid scale updrafts5. We will perform sensitivity tests for different cloud-regimes with different modelled background aerosol concentrations and subgrid scale vertical velocity6 for a range of spray aerosol distributions. The new emulators will be used in WP3.
Deliverable D1.1: (Month 6): Prognostic water and parcel model emulator parameterisations delivered to WP2.
Deliverable D1.2 (Month 12): Improved representation of interstitial aerosol to WP2.
Deliverable D1.3 (Month 18): Publication on the impact of improved representation of interstitial aerosol for MCB.
Deliverable D1.4 (Month 21): Improved cloud droplet activation scheme in CASIM.
Deliverable D1.5 (Month 36): Publication on optimal emulation of cloud droplet activation for MCB using up-to-date methods.
WP2: High-Resolution Modelling (Leads – Stier, UoO 30 PDRA months; Carslaw, UoL 30 PDRA months, co-Is Field, Partridge, Boeing): This WP aims to assess the effectiveness of MCB across a range of model scales to assess parameterisations used in low-resolution climate models against high-resolution models with explicit process representation for a range of MCB relevant strategies.
WP2.1) Analysis of cloud susceptibility across scales; 15 PDRA months (UoO); 18 PDRA months (UoL). Large Eddy Simulations (LES) using the Met Office-NERC Cloud (MONC) model will focus on near-field evolution of aerosol plumes from the point of emission into the cloud layer over domains comparable to the grid-box size of a climate model. Large-domain simulations with ICON-lite with up to 300m resolution will probe the spatio-temporal delivery of CCN to the cloud layer and associated droplet number perturbations for entire cloud decks. Simulations for tropical, mid- and high-latitude cloud regimes will be designed to quantify the scale-dependence of:
i) The sub-cloud aerosol evolution and susceptibility of CDNC through the chain of processes: 1) aerosol vertical transport and mixing to cloud base (including evaporation, see WP1.1), 2) cloud-scale vertical velocities affecting activation, 3) aerosol microphysics, cloud processing and re-evaporation ; 4) aerosol removal affecting aerosol lifetime and cloud response sensitivity; 5) spatio-temporal aerosol variability affecting non-linearities in microphysical responses.
ii) The cloud response to increased CDNC and the resulting radiative perturbation remains a key uncertainty in our understanding of aerosol-cloud interactions and ultimately the efficiency of MCB. While the Twomey effect is well understood, large uncertainties remain for adjustments of cloud fraction and cloud water content modulated by precipitation processes and small-scale evaporation/entrainment feedbacks.
D2.1 (Month 30): Publication on the evolution of MCB aerosol plumes from MCB from high-resolution MONC simulations
D2.2 (Month 30): Publication on cloud susceptibility to surface MCB emissions along the process chain from high-resolution modelling.
WP2.2) Assessing the capability of global climate models to represent MCB; 15 PDRA months (UoO); 18 PDRA months (UoL). We will assess the fidelity of two global climate models (UKESM and ICON) in capturing key ACI processes and the associated radiative perturbations. WP2.1 will pinpoint critical processes in the coarse resolution GCMs that require further improvement and assess their representativeness for global impact studies. We will compare global ICON-HAM-lite simulations with simulations at 1km resolution, a scale that resolves convection explicitly, removing convective parameterizations. Simulations of cloud-regimes from the tropics, mid-latitude and high latitude, in-line with the MCB GCM strategies of WP3 will be performed and the biases in low-resolution models assessed.
Deliverable D2.3 (Month 36): Publication assessing cloud response and radiative forcing to MCB emission in low-resolution climate models for selected cloud regimes.
Deliverable D2.4 (Month 36): Publication on cloud response and radiative forcing along the process chain from MCB emissions in global km-scale ICON-HAM-lite simulations.
WP3: GCM simulations & design (Lead – Haywood, co-Is Chadwick, Wilcox, UoE 36 PDRA months, UoR 12 PDRA months): We will simulate policy-relevant scenarios with UKESM1.1 and compare against those from other GeoMIP models. Using a combination of UKESM1.1 and the simpler FORTE2 model, we will develop optimal MCB deployment strategies that minimise residual climate impacts and document strategies that should be avoided.
WP3.1). Scenarios. 18 PDRA months (UoE). We will use UKESM1.1 for consistency with recent GeoMIP SAI simulations7. Tglobal from SSP2-4.5, will be reduced to 1.5K above pre-industrial using GeoMIP protocols to provide the G6-1.5K-MCB base-case (Table WP3.1). Scenario variants will be performed including overshoot (OS), termination (TERM), and delayed implementation (DI). Sensitivity variants will be performed for deployment altitude (ALT), and activation schemes (Nenes and Emul).
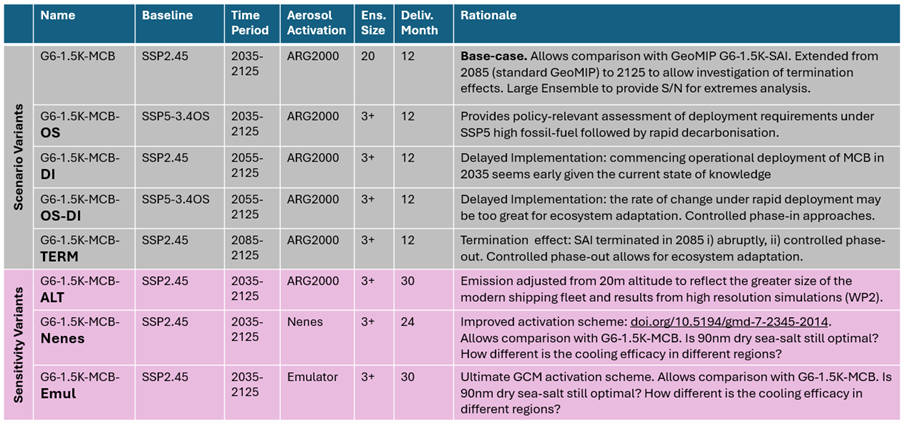
Table WP3.1. Details of Scenario and sensitivity variants.
Deliverables D3.1 (Month 12): Simulations, as per Table WP3.1.
Deliverable D3.2 (Month 36): Publication examining MCB scenario and sensitivity variants in achieving policy-relevant goals.
WP3.2 Strategies. 12 PDRA months (UoE). We will divide oceanic regions in UKESM1.1 into six main latitude bands, and sub-divide these into regions of nominally identical areal extent and apply constant sea-salt emissions to each latitude band and region in turn. Fig WP3.1 shows some preliminary (unpublished) work to demonstrate the utility of the technique in determining the regional and global efficacy of regional MCB deployment.
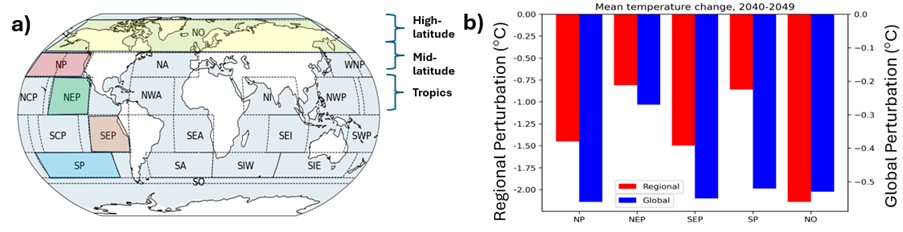
Figure WP3.1. a) The proposed divisions into latitude bands and regions. b) The global and regional temperature responses from the highlighted regions in a).
We will assess the dynamical response by compiling global mean metrics (e.g. ENSO, NAO index, PDO) and patterns of induced climate change in key meteorological and Earth system parameters such as temperature, precipitation, net primary productivity (NPP), and sea-ice. We will examine the additivity of responses and, with input from WP3.3, determine deployment strategies which minimise the detrimental impacts against a basket of target measures, and against the key Earth System components identified in WP5 (Table WP3.2).
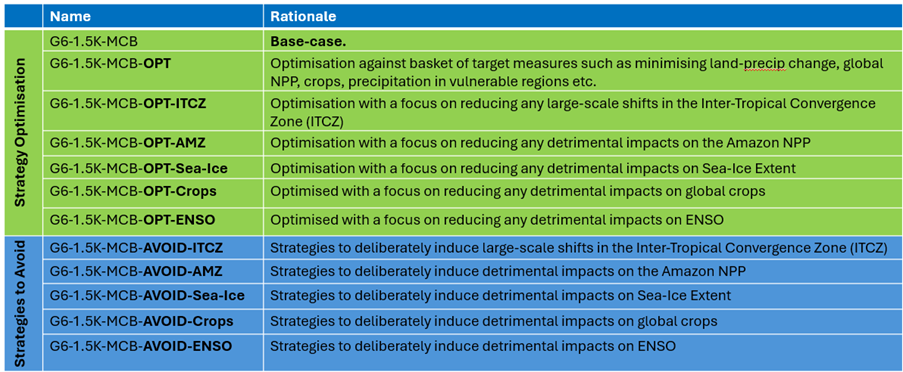
Table WP3.2. Nomenclature of the Strategy Optimisation and Strategies to Avoid.
Deliverable D3.3 (Month 32): Publication examining the impacts of MCB strategy variants on the evolution of the mean climate state.
WP3.3 Optimisation (UoR PDRA 12 months)
To augment the results from UKESM1.1, we will use the reduced complexity coupled model, FORTE28, using prescribed regional aerosol perturbations taken from UKESM1.1 to explore a wider range of MCB deployment combinations than feasible with UKESM1.1. We will explore the linearity and interaction of teleconnections from single and combined MCB regions in driving regional climate responses, and design an optimum deployment strategy and those to be avoided, to inform UKESM1.1 strategies.
Deliverable D3.4 (Month 30): Publication on linearity and optimisation in the reduced complexity FORTE2 model.
WP4: Impacts – Physical climate responses (Lead – Wilcox, UoR 24 PDRA months; co-I Chadwick, co-I Halloran, UoE 12 PDRA months): Significant changes in temperature and precipitation can occur far from MCB deployment regions; due to teleconnections that change the large-scale atmospheric and oceanic circulation. WP4 aims to understand these processes.
WP4.1) Temperature, precipitation, and other extremes. 6 PDRA months (UoR). We will analyse G6-1.5K-MCB and OS and OPT scenarios (Tables WP3.1 & WP3.2) and quantify the global and regional precipitation and temperature responses, and their rates of change. For extremes, we will use Expert Team on Climate Change Detection and Indices (ETCCDI) metrics, alongside wildfire metrics (e.g. Fire Weather Index9) and marine heatwave metrics10. We will use common hurricane proxies based on precipitation and vertical wind-shear within the maximum development region to assess impacts on hurricane frequency11.
WP4.2 Signal-to-noise detectability. 6 PDRA months (UoR). Responses in WP4.1 will be considered relative to internal variability via signal-noise metrics, and the time of emergence of the MCB signal from the SSP2-4.5 baseline will be quantified. Inter-model G6-1.5K-MCB responses will be examined through collaboration with the GeoMIP community.
Deliverable D4.1 (Month 21): Publication on the regional impacts of MCB and when they emerge in UKESM1.1.
WP4.3 Monsoons and ITCZ. 12 PDRA months (UoR). We will apply an energy budget approach to examine how MCB perturbations drive meridional shifts in the Atlantic/Pacific ITCZ and regional monsoons (e.g. Indian subcontinent, West Africa, Sahel). Under the G6-1.5K-MCB, OS, OPT-ITCZ, and AVOID-ITCZ scenarios, we will examine the shift in the ITCZ positions and associated rainfall during regional monsoon seasons. WP3.3 will inform whether combined MCB deployments can minimise ITCZ shifts.
Deliverable D4.2 (Month 42): Publication on the drivers of monsoon responses to MCB.
WP4.4 ENSO and AMOC. 12 PDRA months (UoE): Using the G6-1.5K-MCB and scenario and strategy variants (Table WP3.1 & WP3.2), we will examine the coupled ocean-atmosphere processes by which different MCB perturbations produce time-mean ENSO-like SST, precipitation, and circulation responses, including remote teleconnections, changes to the Walker and Hadley circulations, the Equatorial Pacific thermocline and upwelling response, and metrics of ENSO variability. We will examine changes in the AMOC and the link to sub-polar and equatorial Atlantic surface fluxes, subpolar gyre circulation, North Atlantic deep convection and transport of heat towards Western Europe and the Arctic, feeding into WP5.1 & 5.2.
Deliverable D4.3 (Month 24): Publication on the dynamics driving changes in ENSO and AMOCunder various MCB deployments.
WP5. Impacts – Earth System Responses (Lead, Halloran, UoE PDRA (36 months), co-Is Haywood, Chadwick, Wilcox): WP5 will focus on MCB-induced impacts from the G6-1.5K-MCB scenario and those that either ameliorate or exacerbate detrimental climate responses on key elements of the Earth System.
WP5.1. Sea-ice, 6 PDRA months (UoE). From 2020 to 2100, the maximal extent of sea-ice reduces from around 18-12 million km2 under SSP2-4.5 in UKESM1. We will assess sea-ice under scenario variants (Table WP3.2, G6-1.5K-MCB, OPT-Sea-Ice, AVOID-Sea-Ice, Table WP3.1) with a focus on the horizontal and vertical perturbations to atmosphere and ocean temperatures, ocean salinity, AMOC, and meridional transports diagnosed in WP4.4.
WP5.2. ENSO and marine ecosystems, 6 PDRA months (UoE). ENSO variability drives diverse marine impacts on ecosystems12, fisheries13, heat waves impacting coral bleaching14, and sea level rise15. Extending WP4.4, we will assess impacts of MCB-induced generated El Nino and La Nina like conditions on tropical Pacific primary production and oxygen minimum zone expansion, tropical marine heat stress and coral mortality16, and regional sea level rise. We will quantify the impact of modified ENSO on air-sea carbon fluxes, and contextualise this in the global ocean carbon cycle response that balances cooling driven change in CO2 solubility with changed upwelling of deep carbon and modification to the biological carbon pump.
WP5.3. Crops, 9 PDRA months (UoE). Typically SRM impacts crop productivity by surface cooling, changes in rainfall, and the quantity and diffuse fraction of solar radiation17. SRM studies find a general increase in NPP1918 and a decrease in crop failures19. The regional nature of MCB deployment and responses will likely have very different impacts on crop yield. WP5.2 will explore crop yields worldwide (G6-1.5K-MCB, OPT-crops, AVOID-crops) using output from UKESM1.1 in JULES-CROP20.
WP5.4. Amazon rainforest, 9 PDRA months (UoE). Targeting the South East Atlantic (SEA) with MCB can lead to a significant vegetation dieback over Amazonia21. We will assess the response of G6-1.5K-MCB, OPT-AMZ and AVOID-AMZ (Table WP3.1) with a focus on surface temperature, precipitation, the surface energy budget, ecosystem and carbon exchange.
Deliverables: D5.1 (Month 30), D5.2 (Month 36), D5.3 (Month 27), D5.4 (Month 36): Publications on respective Earth system responses.
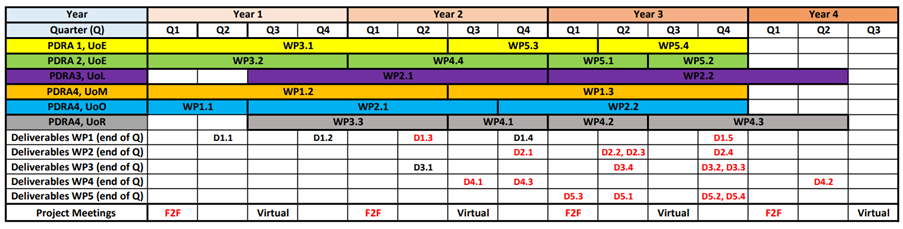
Table WP3.3, Gantt chart showing the timing of the PDRAs and Deliverables (red show publications).
Outputs will be maximised via the strong connections with the SRM community; PI Haywood’s GeoMIP, WCRP and EXTEND (NE/W003880/1) activities (see capability to deliver) assure active engagement with the wider SRM communities. Additional GeoMIP publications with MACLOUD co-authors are envisaged. MACLOUD will use existing strong links to government (see capability to deliver) to provide a government brief at the conclusion of MACLOUD. Haywood anticipates submitting on SRM to REF29.