News

New paper: Quantitatively monitoring the resilience of patterned vegetation in the Sahel

Josh Buxton has recently published a paper which provides a method for quantifying the morphology of patterned vegetation and analyses the changing resilience of these sites over time using satellite data. You can find the work online.

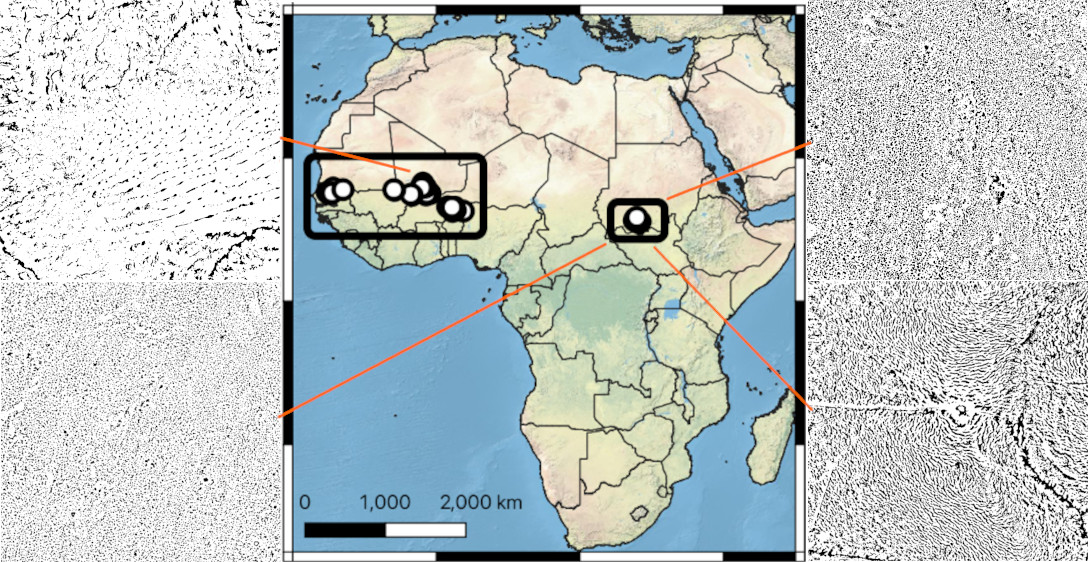
Vegetation patterns form in dryland areas as a response to declining precipitation levels. They have also been hypothesised to be indicators of the resilience of the vegetation system. Previous studies have made this qualitative link and used models to quantitatively explore it, but few have quantitatively analysed available data to test the hypothesis. Here we provide methods for quantitatively monitoring the resilience of patterned vegetation, applied to 40 sites in the Sahel (a mix of previously identified and new ones).
We show that an existing quantification of vegetation patterns in terms of a feature vector metric can effectively distinguish gaps, labyrinths, spots, and a novel category of spot–labyrinths at their maximum extent, whereas NDVI does not. The feature vector pattern metric correlates with mean precipitation. We find that vegetation resilience is linked to precipitation, but we find no significant correlation between patter morphology and resilience.

New PhD student: James Young

James is a PhD student undertaking an EPSRC funded PhD titled: “Social and Environmental Data Science”, supervised by Prof. Hywel Williams, and Dr. Rudy Arthur.

His research interests include investigating alternative unstructured data sources for improving our understanding of natural hazards and climate change, specifically social media data.

After completing a Mathematics BSc and Data Science MSc from the University of Exeter, he worked as a research associate (RA) between 2020 and 2021 where his research projects included:
• Social Sensing Kerala Floods. This project compared government flood impact data for the 2018 Kerala flood to three social media data sources. Results showed strong agreement between the government data and social media data, with the latter sources enabling real-time monitoring for free.
• Social Sensing for Resilient Cities. Facebook data regarding extreme heat was collected and analysed, with a dashboard produced to highlight the cabability of social media data for improving our understanding of heatwaves. This was presented to resilience representatives from the London, Athens, and Hague councils.

New paper: Community‑driven tree planting greens the neighbouring landscape

Josh, Rudy and Hywel have recently published a paper analysing the impact of community-based tree planting on greening the landscape in the Mount Kenya region. You can find the work online.

Land degradation reduces the resilience of both terrestrial systems and the capacity of agricultural communities to adapt to climate change. Sub-Saharan Africa has experience extensive land degradation, this is expected to continue in the future and this will threaten the livelihoods of smallholder farmers.

For this project, we partnered with The International Small group and Tree planting program (TIST) in Kenya. TIST is a farmer-led network organised around agroforestry and regenerative farming practices, this network consists of over 100,000 members in Tanzania, Uganda, Kenya and India.

We combine Landsat-7 satellite imagery with site data from TIST farms to examine the effect of TIST tree planting in the Mount Kenya region. We identify a positive greening effect in TIST groves between 2000-2019 relative to the wider agricultural landscape. These groves cover 27,198 ha, and a further 27,750 ha of neighbouring agricultural land is also positively influenced by TIST. TIST also benefits local forests, e.g. through reducing fuelwood and fodder extraction. Our results show that community‑led initiatives can lead to successful landscape‑scale regreening on decadal timescales.

New paper: Community evolution on Stack Overflow

Iraklis and Hywel have recently published a new paper investigating the growth of the Q&A communities on Stack Overflow, which is now available online.

Question and answer (Q&A) websites are a medium where people can communicate and help each other. Stack Overflow is one of the most popular Q&A websites about programming, where millions of developers seek help or provide valuable assistance. Activity on the Stack Overflow website is moderated by the user community, utilizing a voting system to promote high quality content. The website was created on 2008 and has accumulated a large amount of crowd wisdom about the software development industry. Here we analyse this data to examine trends in the grouping of technologies and their users into different sub-communities. In our work we analysed all questions, answers, votes and tags from 21 Stack Overflow between 2008 and 2020. We generated a series of user-technology interaction graphs and applied community detection algorithms to identify the biggest user communities for each year, to examine which technologies those communities incorporate, how they are interconnected and how they evolve through time. The biggest and most persistent communities were related to web development. In general, there is little movement between communities; users tend to either stay within the same community or not acquire any score at all. Community evolution reveals the popularity of different programming languages and frameworks on Stack Overflow over time. These findings give insight into the user community on Stack Overflow and reveal long-term trends on the software development industry.

New paper: Social Sensing of Heatwaves

James, Rudy, Michelle and Hywel have recently published a paper investigating the use of Twitter data for detecting heatwaves. The work is available online.

Heatwaves cause thousands of deaths every year, yet the social impacts of heat are poorly measured. Temperature alone is not sufficient to measure impacts and “heatwaves” are defined differently in different cities/countries. This study used data from the microblogging platform Twitter to detect different scales of response and varying attitudes to heatwaves within the United Kingdom (UK), the United States of America (US) and Australia. At the country scale, the volume of heat-related Twitter activity increased exponentially as temperature increased. The initial social reaction differed between countries, with a larger response to heatwaves elicited from the UK than from Australia, despite the comparatively milder conditions in the UK. Language analysis reveals that the UK user population typically responds with concern for individual wellbeing and discomfort, whereas Australian and US users typically focus on the environmental consequences. At the city scale, differing responses are seen in London, Sydney and New York on governmentally defined heatwave days; sentiment changes predictably in London and New York over a 24-h period, while sentiment is more constant in Sydney. This study shows that social media data can provide robust observations of public response to heat, suggesting that social sensing of heatwaves might be useful for preparedness and mitigation.