
Posted by Ted Feldpausch
16 September 2026Amazonia’s climate is not changing gradually or evenly, and the averages we usually report hide the changes that matter most. That is the central message of a study published on 10 September in Communications Earth & Environment by a team of more than 50 scientists led by Lancaster University with WWF-UK and Brazilian partners, and co-authored at the University of Exeter.
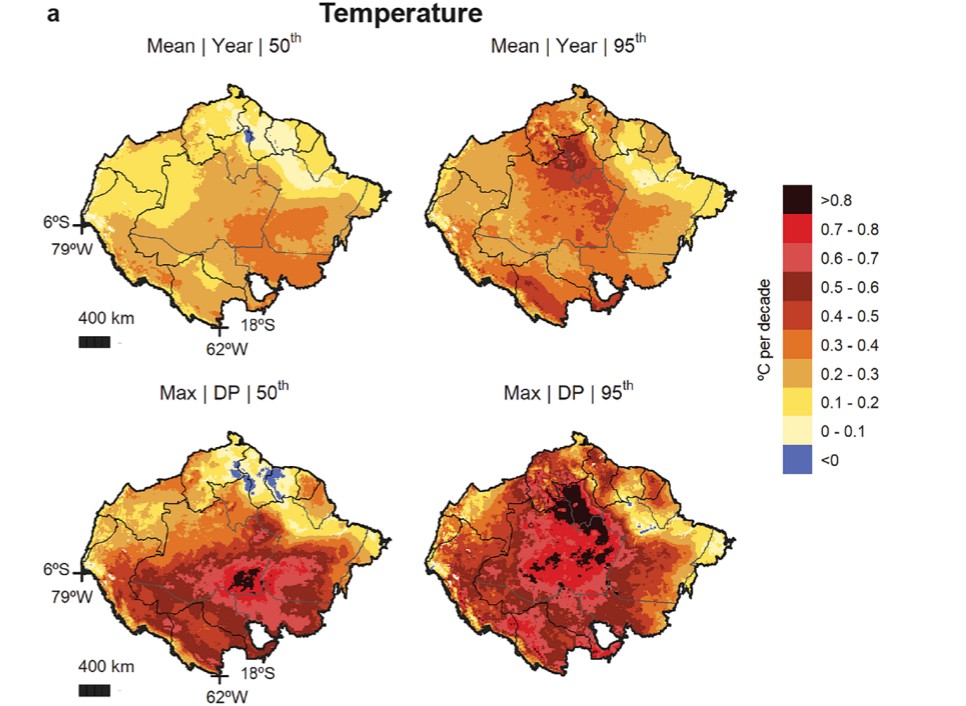
The study finds that the Amazon’s extremes are running well ahead of its averages. Across the basin, mean annual temperature has risen by 0.21 °C per decade since 1981, in line with the global average. But in the driest part of the year, the hottest years (the 95th percentile of maximum temperature) have warmed by 0.49 °C per decade, more than twice as fast. Over 43 years that is a 2.11 °C increase in the conditions that actually damage forests and harm people, against 0.90 °C for the annual mean.
The bigger surprise is where this is happening. The southern Amazon, along the arc of deforestation, is confirmed as the fastest-warming region on average. The fastest growth in extremes, however, sits in the central-north Amazon, a region rarely flagged as being at climate risk. More than 700,000 square kilometres there, an area nearly three times the size of the United Kingdom and about 10% of the biome, has seen dry-season temperature extremes rise by at least 0.75 °C per decade, more than 3.22 °C since 1981. This is a region of high forest cover, native savannas and vast Indigenous territories, including the Coata-Laranjal, Waimiri-Atroari, Yanomami and Trombetas/Mapuera lands.
The team divided Amazonia into 11 km cells and, crucially, gave every cell its own hydrological year, defined from its own wettest period rather than from a fixed calendar. That matters because the dry season north of the equator does not coincide with the dry season in the south, so basin-wide studies anchored to southern Amazonian seasonality miss what is happening in the north. Using ERA5-Land reanalysis for temperature and humidity and CHIRPS for rainfall from 1981 to 2023, the authors then tracked not only the central trend but the tails of the distribution, the exceptionally hot and dry years.
Two further results stand out for anyone working on forest response. First, the increases in water stress are being driven by temperature, not by declining rainfall. Vapour pressure deficit in the driest period rose by 0.08 kPa per decade at the 95th percentile, and a maximum cumulative water deficit that allows evapotranspiration to rise with temperature dried by 12.8 mm per decade at the extreme, roughly twice the central trend. The conventional water-deficit measure, which holds evapotranspiration fixed at 100 mm per month, shows no trend at all. In other words, the standard metric used across two decades of Amazon drought research is not showing a large part of the drying that warming is causing.
Second, the fastest-changing region is far from the deforestation frontier. Local land-use change cannot explain it, which points at global greenhouse gas emissions as the driver, and at the responsibility of the highest-emitting countries for what is happening to Amazonia.
There is already evidence that these extremes are having an impact in the central-north. The region has seen the first recorded mass mortality of forest mammals in Amazonia, declines in understorey bird populations and shifts in bird lifespans and morphology, extreme losses of surface water and abrupt changes in fish assemblages. Extreme heat and water deficit contributed to the extensive fires in Roraima and in the flooded forests of the Rio Negro, and those fires drove record air pollution and hospital admissions in Manaus.
With a strong El Niño forecast for late 2026, only two years after the 2024 drought, the authors argue that adaptation planning has to be built on where extremes are changing, not on where averages are changing. They also make the case for preventing further frontier advance into the central-north, because deforestation, edge creation, logging and new ignition sources would amplify exactly the fire and heat risks that are already rising there fastest.
Professor Jos Barlow of Lancaster University, lead author, said: “Given the area that is experiencing the fastest growth in extreme temperature is far from the arc of deforestation, these rapid rises cannot be explained by local changes such as deforestation and land-use changes. It’s showing how the Amazon is being affected by global climate change. It’s the world’s emissions that are responsible.”
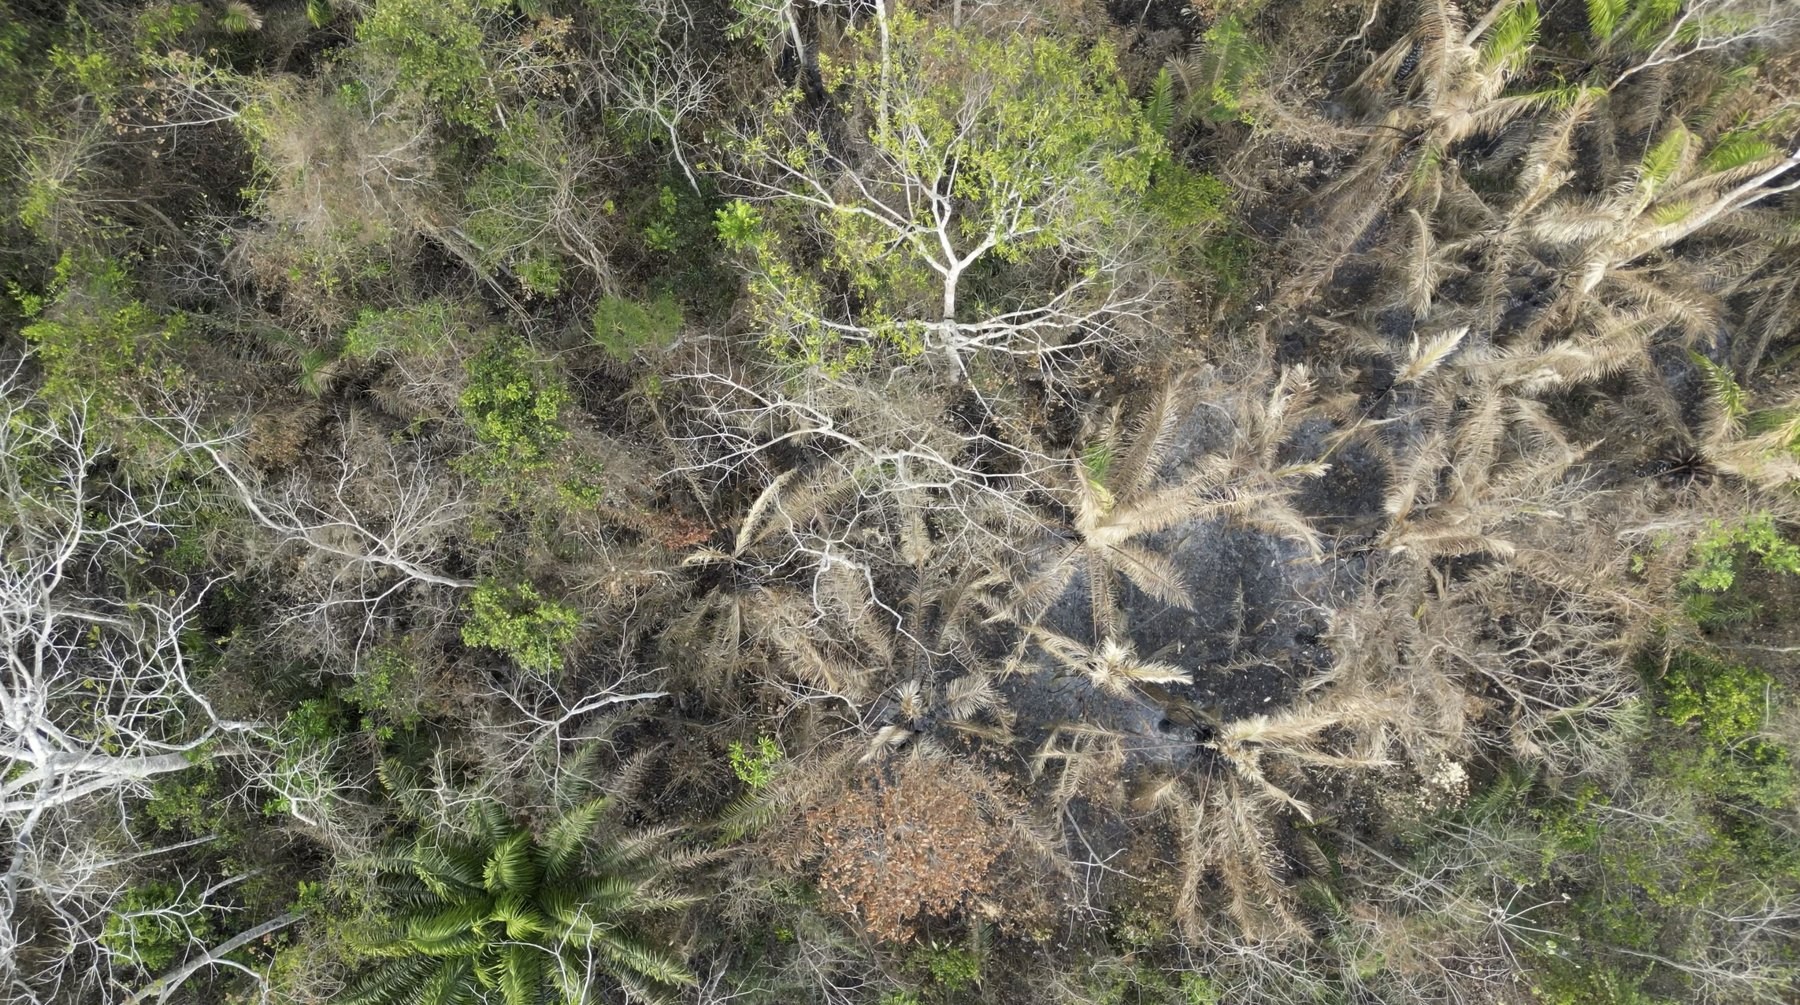
Professor Ted Feldpausch of the University of Exeter, a co-author, said: “These temperature changes are placing new areas at risk. An Amazon forest does not burn on an average day. It burns on the hottest, driest days of the year, and those are exactly the days this study shows are changing fastest.”
University of Exeter professors Stephen Sitch, Ted Feldpausch, Lina Mercado, and Lucy Rowland contributed to this study as part of their NERC-funded Amazon SOS project.
The maps of change in temperature, vapour pressure deficit and precipitation can be explored interactively at the project’s data platform, and the analysis code and outputs are archived at Zenodo.
Reference: Barlow, J., Carvalho, N.S., Nunes, C.A., Aguiar, A.P.D., Alencar, A., Anderson, L.O., Aragão, L.E.O.C., Baccaro, F., Barrett, M., Berenguer, E., … Feldpausch, T.R., … Wiederhecker, H.C. (2026) Rapid increase of climate extremes reveals new areas of concern in Amazonia. Communications Earth & Environment. https://doi.org/10.1038/s43247-026-03975-1
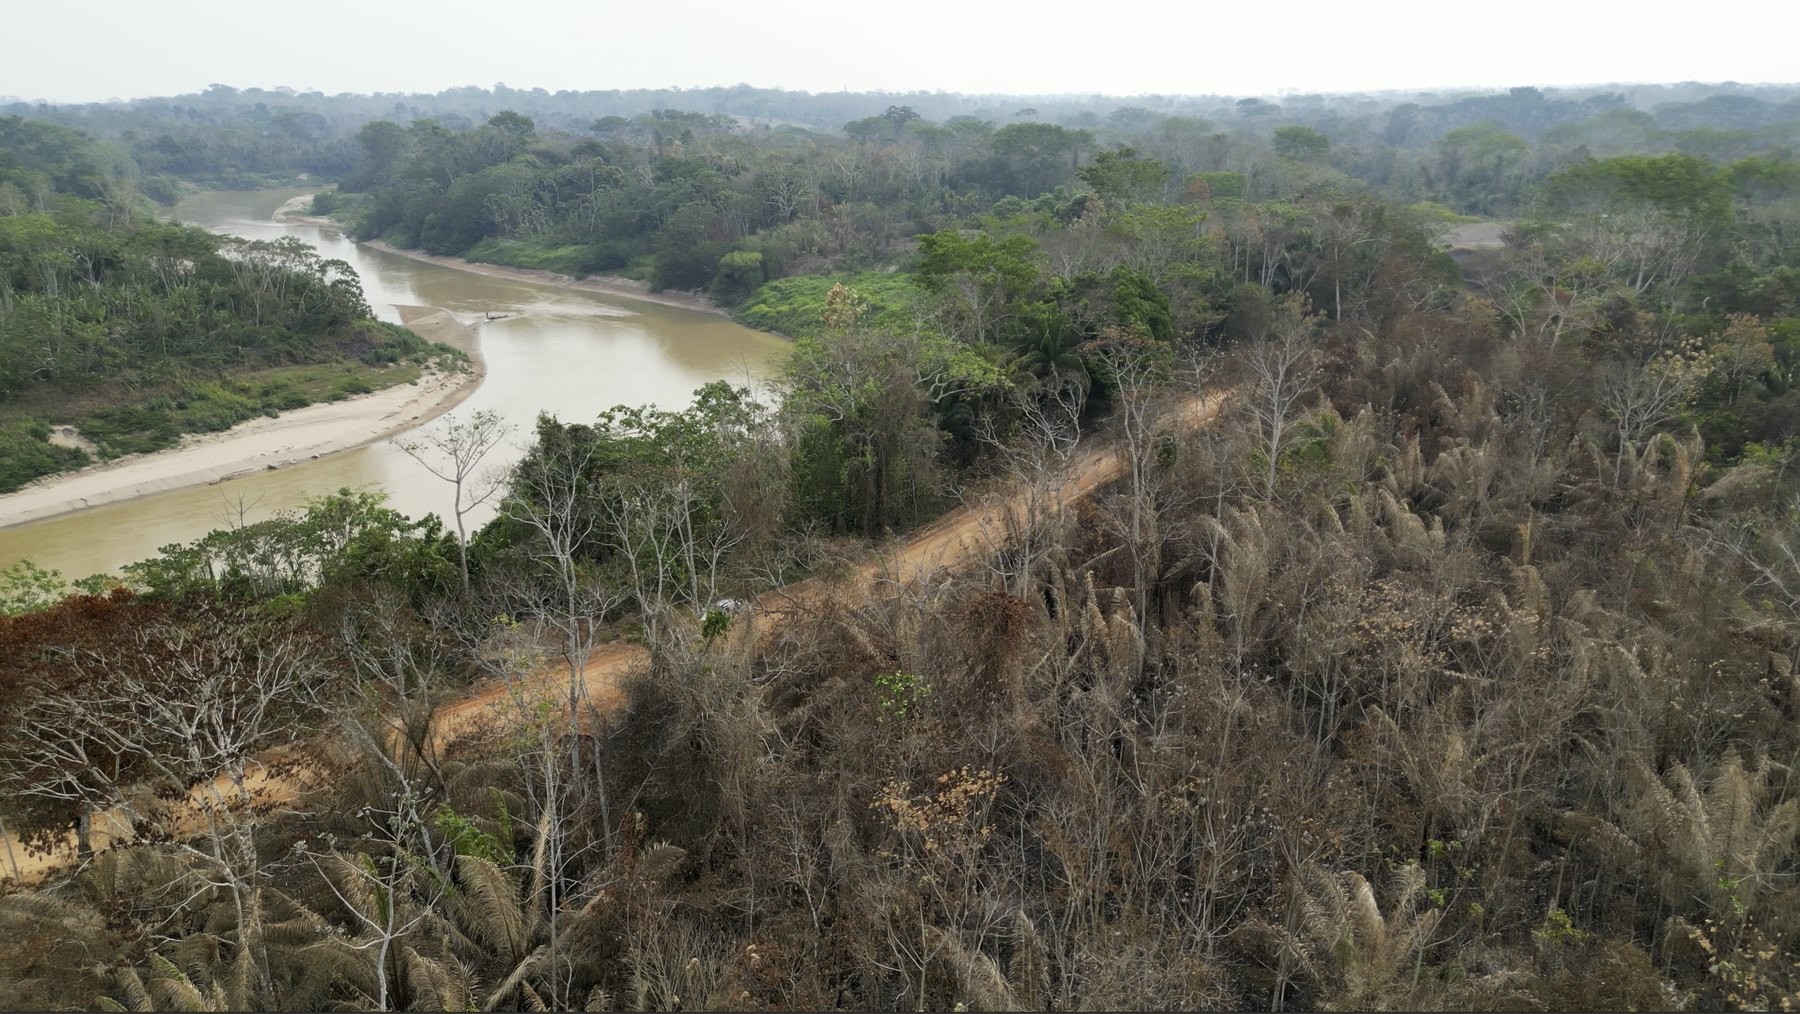
Header photo: © Ted Feldpausch. Amazon forest degraded by drought and fire, Acre, southwest Amazonia.